Charts
XRP charts, candle by candle
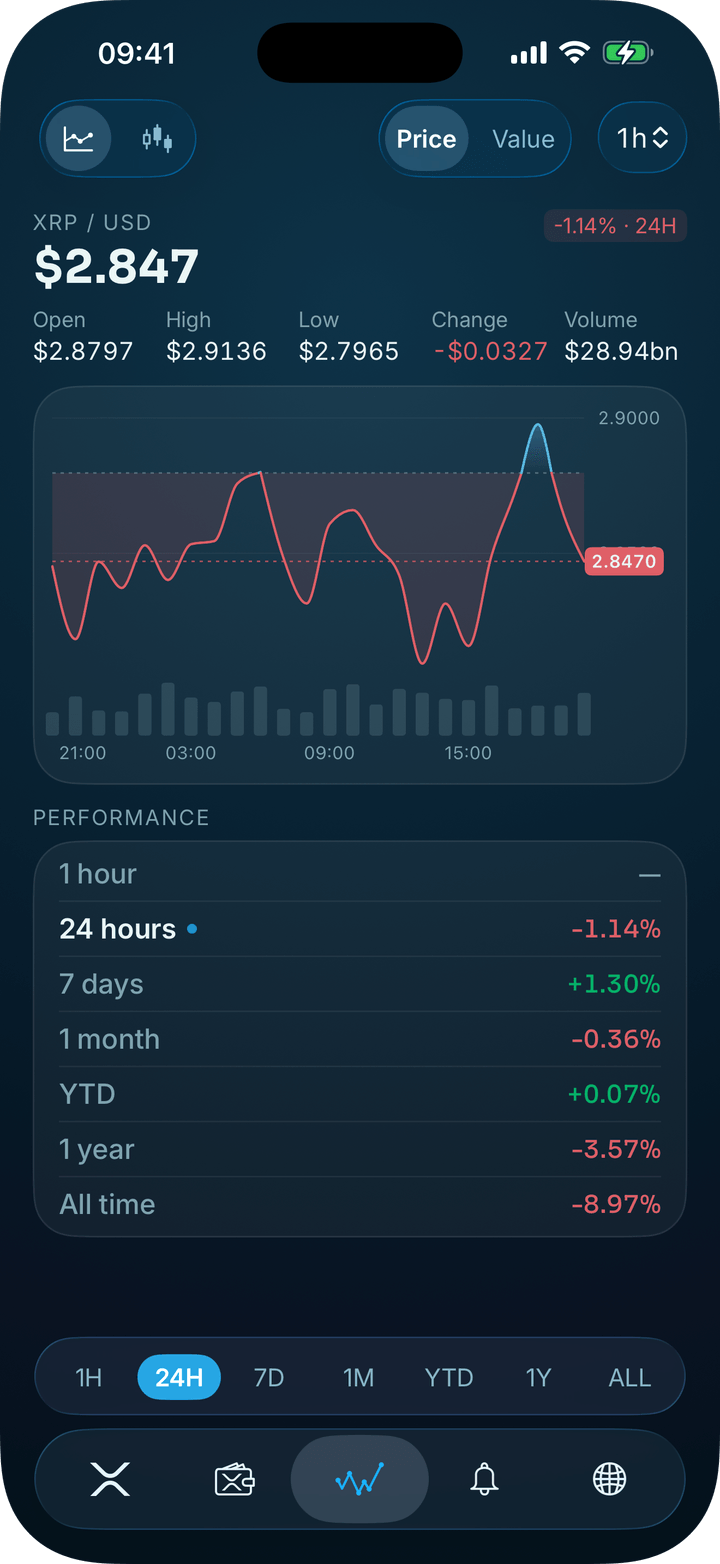
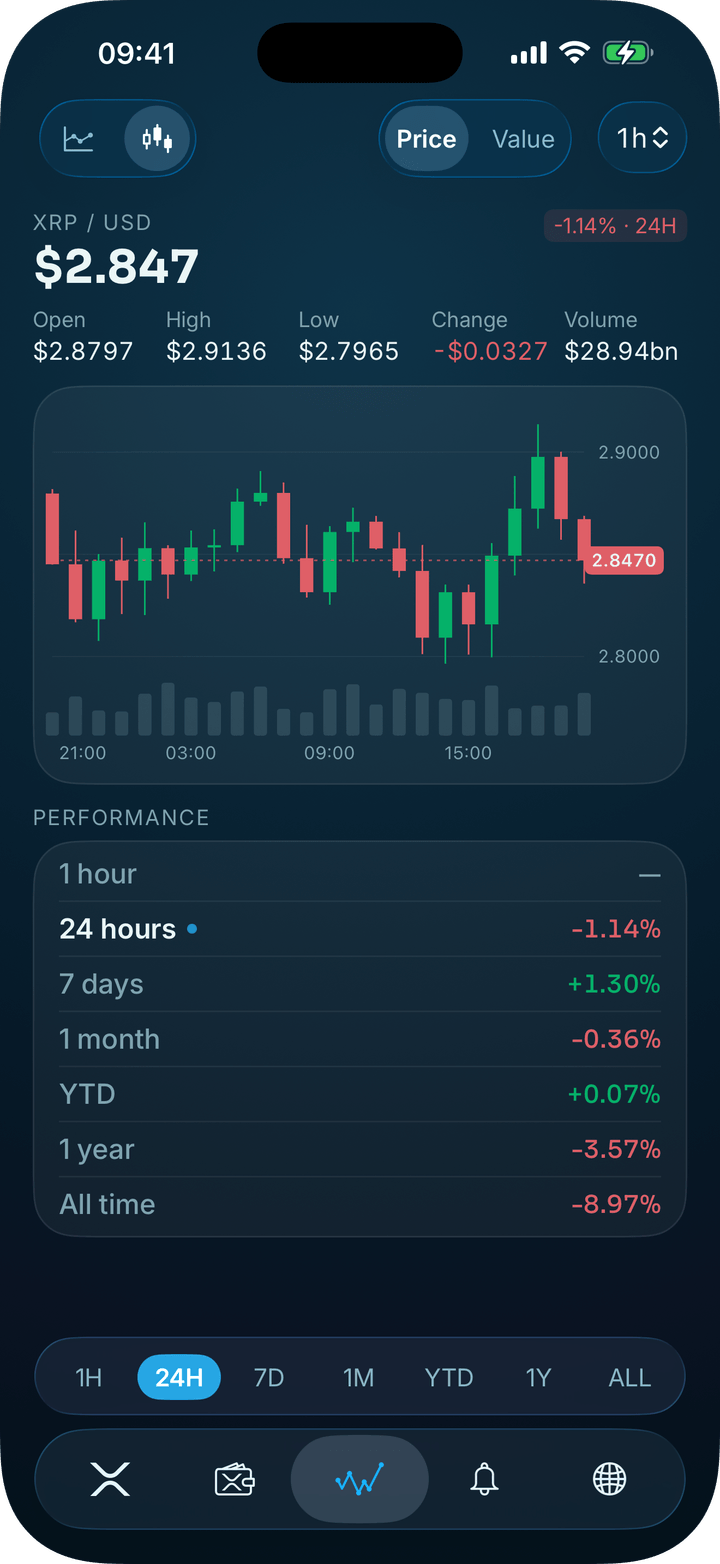
Follow XRP from the last hour back to its first trade. Switch between a line and candlesticks, zoom into any period with two fingers, and chart what your own XRP has been worth.

1
Every range
One hour, a day, a week, a month, the year to date, a year or all time, with the open, high, low and close at any point.
2
Candles and zoom
Switch to candlesticks and pinch into any stretch of the chart to see it in finer detail.
3
Your XRP, charted
Flip the chart to your portfolio's value to see how your holdings have moved, not just the price.
Explore more
More of what XRP Alerts can do
WidgetsPrice, wallet, stats, chart and news widgetsApple WatchPrice, charts and complications on Apple WatchiPhone DuoTwo panes on the inner display, in every poseiPadWider layouts for Home, Charts and NewsNewsXRP headlines with sentiment, saved for laterLive PriceThe XRP price and market stats in 34 currencies
Everything XRP. One app.
The price on your Lock Screen, your profit and loss to hand, and no account to create.
- Live price on your Lock Screen
- Alerts at the prices you set
- Your holdings, valued live
- Widgets and Apple Watch
Rated 4.6 out of 5 from 4,400+ App Store ratings.